Templates
From complex ML forecasting to critical business dashboards, Hex lets data teams work together in Python, SQL, and no-code to do more with data, together.
Time Series
Discover meaningful patterns and trends by visualizing data over time.
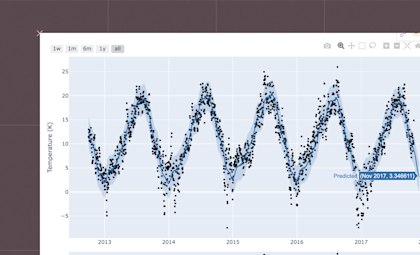
Time Series Forecasting with Prophet
Izzy Miller, Dev Advocate at Hex
Make simple time series modeling easy and configuration-free with Prophet
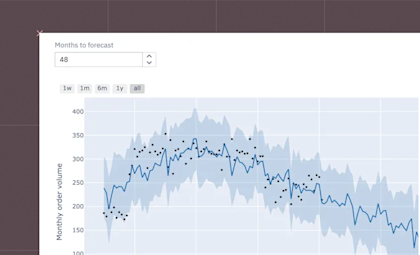
Time Series Forecasting
One workspace with everything you need to build complex time series models
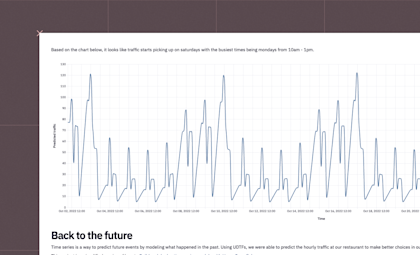
Time series analysis in Snowpark
Forecast hourly restaurant traffic using UDTFs in Snowpark
Reporting
Bring your business data to life with interactive reports, beautiful dashboards, and rich data stories.
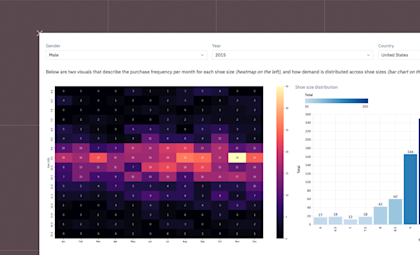
Inventory management
Izzy Miller
Leverage insights to make informed decisions about product inventory and ensure availability
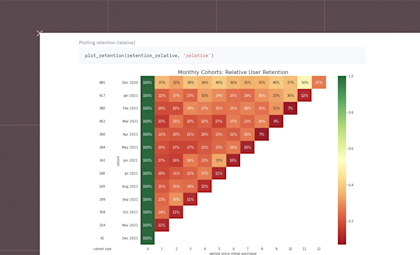
Cohort analysis
Izzy Miller
Analyze groups of customers to understand retention, predict churn, and find other patterns.
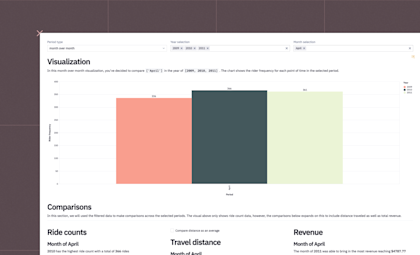
Period over period analysis
Izzy Miller
Compare various points in time across multiple periods
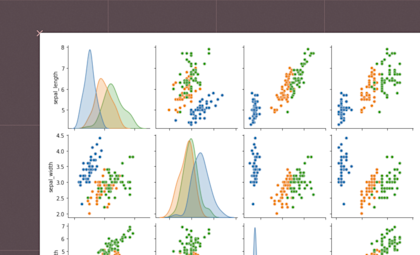
Python Data Visualization
Izzy Miller
Leverage Hex to transition from SQL data warehouse insights to dynamic visual storytelling using Python's top visualization libraries.
Parameterized Queries
Upgrade your projects with parameterized SQL queries. Create interactive dashboards and exploratory data analysis with SQL queries that dynamically react to user input using Hex.
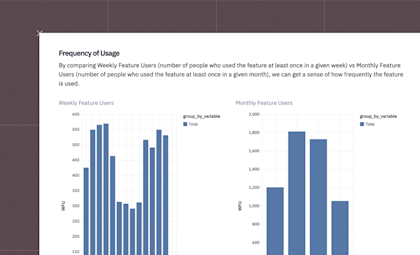
Feature Success Interactive Dashboard
Jo Engreitz
Build feature success dashboards with Hex. Monitor usage metrics using parameterized SQL, create interactive visualizations and effortlessly share your work.
Feature Selection
Determine the most appropriate features of your Machine Learning model to make it easy to interpret, get accurate results, reduce overfitting, and optimize your computational resources.
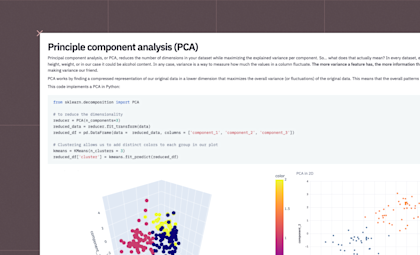
Linear Dimensionality Reduction
Izzy Miller
Visualize high dimensional data using linear reduction techniques
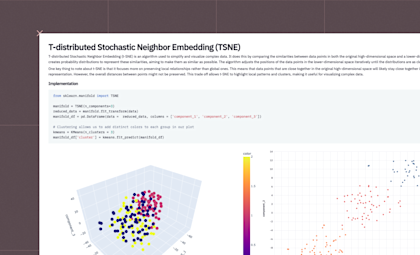
Non-linear dimensionality reduction
Visualize high dimensional data using non-linear reduction techniques
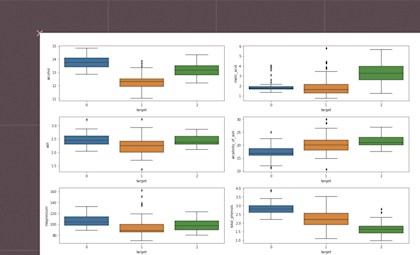
Feature Selection
Seamlessly apply feature selection methods to data fresh from your SQL warehouse
Data Modeling
Take raw data and transform it into ready to use data sets for predictive models, interactive apps for exploration, or for company reporting.
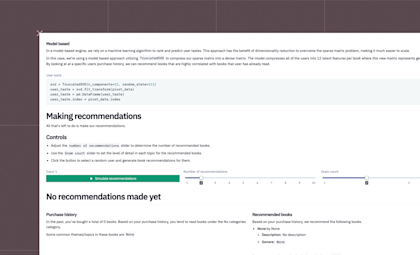
Collaborative filtering
Izzy Miller
Build a recommendation engine with Hex and Python. Use collaborative filtering to find similar products and make personalized recommendations based on purchase history..

Market Basket Analysis
Identify high-impact product pairings and optimize promotional strategies with apriori market basket analysis
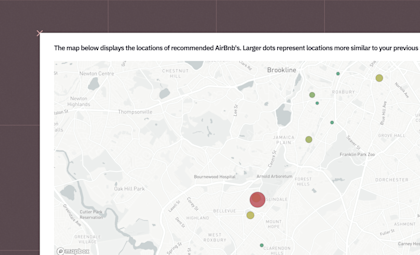
Content based filtering
Content-based filtering and collaborative filtering are two data modeling techniques for recommending items to users. Turn your complex logic into an easily digestible app in Hex that anyone can use and start getting recommendations within seconds.
Data Science
Unearth hidden insights and power business decisions with machine learning— or just good old applied statistics.
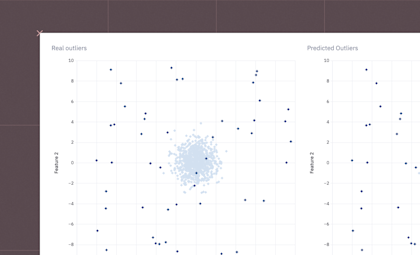
Outlier Detection
Izzy Miller
Detect and analyze anomalies in your dataset using robust Outlier Detection methods.
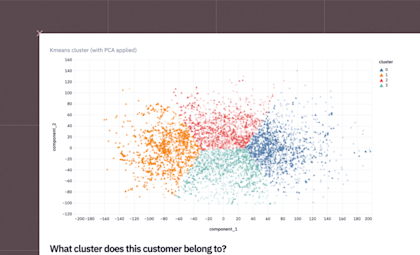
Churn Prediction
Izzy Miller
Hex is a powerful development environment for churn prediction. It supports SQL, Python & R. It makes it easy to deploy accurate and scalable models.
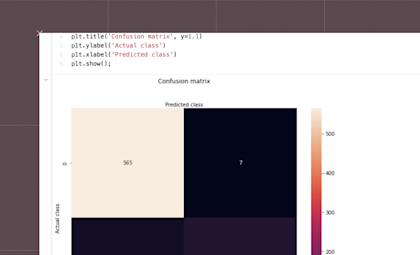
ML Model Development
Izzy Miller
Build, test, and deploy powerful ML models

Build, test, and deploy powerful ML models
Izzy Miller
Hex is the most powerful development environment for prototyping and deploying predictive models. Get started with Hex and direct SQL access to your data warehouse, a polyglot environment for developing and deploying models, and a built in app builder.
Data Clustering
Unleash the power of data clustering—an unsupervised machine learning technique that uncovers patterns and groups similar data together without the need for labeled data.
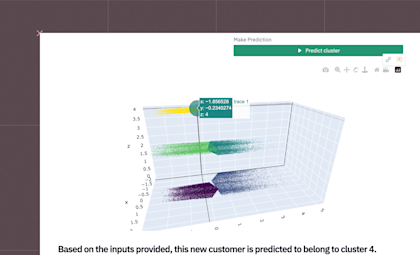
Customer Segmentation
Izzy Miller
Group users and customers into intelligent segments
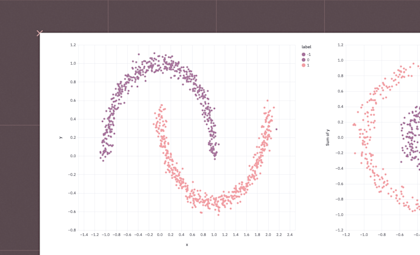
Clustering algorithms
Group similar data points together to discover patterns, structures, or subgroups within a dataset.
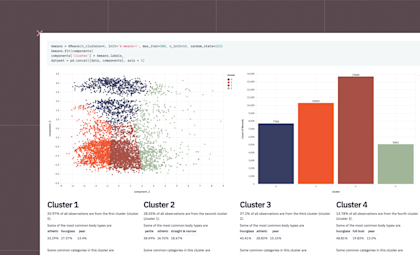
Cluster analysis
Build an interactive K-means clustering app in minutes with Hex. Scale, reduce, and encode your features using Python— and then create an interactive app using input parameters.
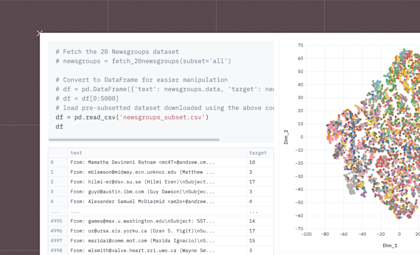
Document Similarity with Embeddings
Explore document similarity using embeddings, swiftly visualizing and interpreting text clusters from your SQL warehouse.
Snowpark
Use Hex with Snowpark for Python to do complex data science on datasets of any scale
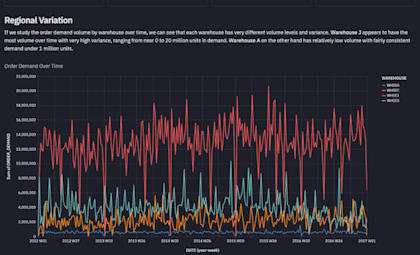
Snowpark Manufacturing Demand Forecast Demo
Forecast manufacturing demand using Prophet and Snowflake
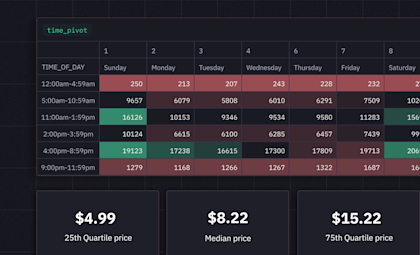
Customer Behavior Analysis And New Product Sales Forecasting
Analyze customer purchasing behavior for new product development

Time series analysis with Snowpark
Forecast hourly restaurant traffic using UDTFs in Snowpark
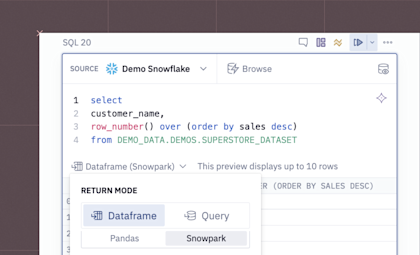
Data Science with Snowpark
The easy button for Snowpark
Data Visualization
Transform raw data into actionable insights with interactive visualizations, dashboards, and data apps.

Python Data Visualization
Izzy Miller
Leverage Hex to transition from SQL data warehouse insights to dynamic visual storytelling using Python's top visualization libraries.
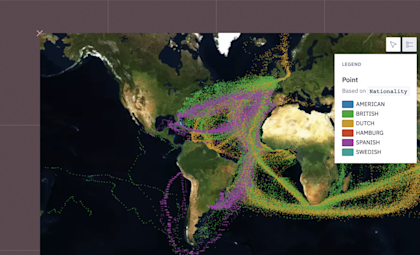
Python mapping libraries
Izzy Miller
Access Python's powerful mapping ecosystem right alongside SQL and native geospatial tools
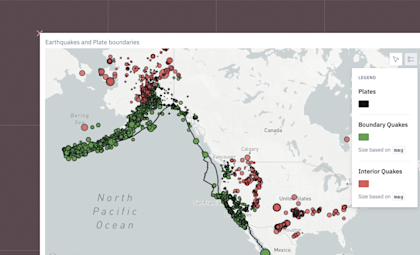
Geospatial Data Analysis
Use powerful GIS techniques alongside SQL and built-in mapping tools
Natural Language Processing
Empower your AI and ML applications to interpret, recognize, and generate human language with powerful Natural Language Processing (NLP) algorithms.
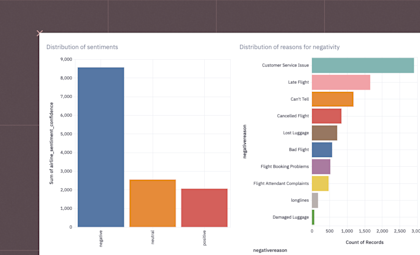
Social Media Sentiment Analysis
Izzy Miller
Parse out insights and trends from the sea of tweets, posts, and threads
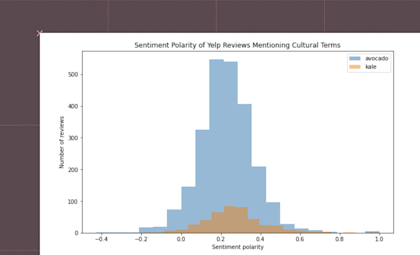
Sentiment Analysis
Understand the meaning behind your unstructured text data, from reviews to support requests
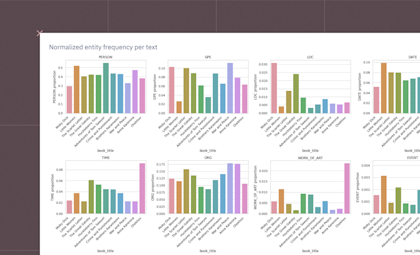
Named Entity Recognition
Uncover the hidden entities in your text data, from classic literature to customer feedback.
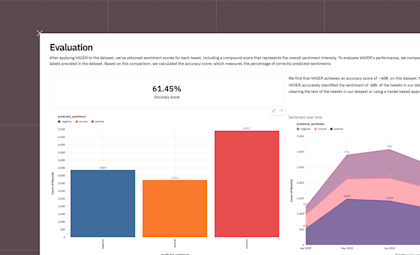
VADER sentiment analysis
Izzy Miller
Analyze social media data to understand the overall sentiment of users.
Exploratory Analysis
Deep dives, rabbit holes, side quests, and ad-hoc explorations.
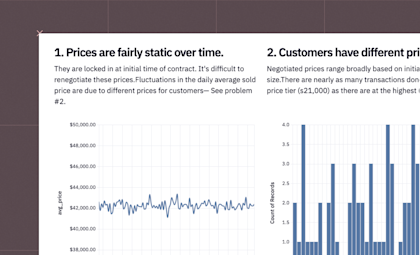
Ad-hoc exploration
Izzy Miller, Dev Advocate at Hex
Answer complex questions fast, and communicate results clearly
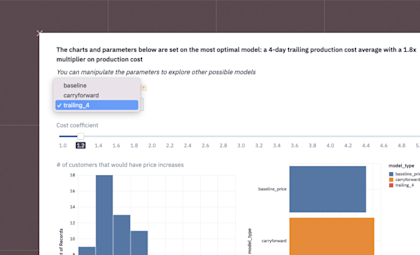
Interactive Data stories
Izzy Miller
Build rich, interactive data stories and documents
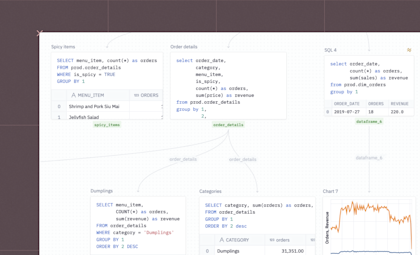
SQL Notebooks
Izzy Miller
The most powerful SQL IDE ever made
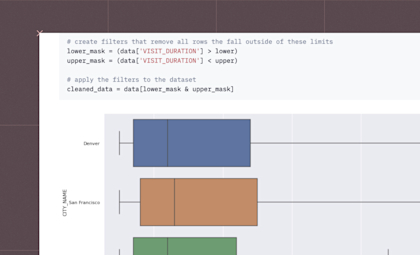
Exploratory Data Analysis
Izzy Miller
Make EDA easy with Hex's powerful data platform
KPI Dashboards
Track and monitor business KPIs, offer insights into sales performance, customer satisfaction, and operational efficiency.
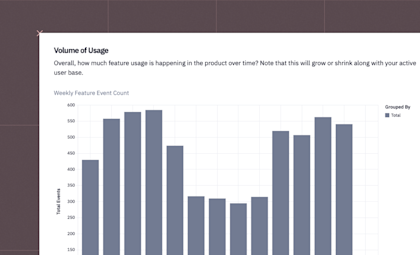
Feature Success
Jo Engreitz
Measure Feature adoption, retention and satisfaction with this interactive Hex app.

Python Data Visualization
Izzy Miller
Leverage Hex to transition from SQL data warehouse insights to dynamic visual storytelling using Python's top visualization libraries.

Customer Churn Dashboard
Izzy Miller
Reduce customer churn with predictive insights
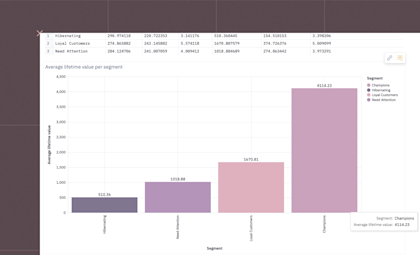
Customer lifetime value Dashboard
Izzy Miller
Improve customer retention and profitability with detailed LTV analysis.
Sentiment Analysis
Decipher subjective information in text to determine its polarity and subjectivity, explore advanced techniques and Python libraries for sentiment analysis.

Social Media Sentiment Analysis
Izzy Miller
Parse out insights and trends from the sea of tweets, posts, and threads

Sentiment Analysis
Understand the meaning behind your unstructured text data, from reviews to support requests

Named Entity Recognition
Uncover the hidden entities in your text data, from classic literature to customer feedback.

VADER sentiment analysis
Izzy Miller
Analyze social media data to understand the overall sentiment of users.